The Decision Tree
- Illustrate the decision tree corresponding to the binary search process.
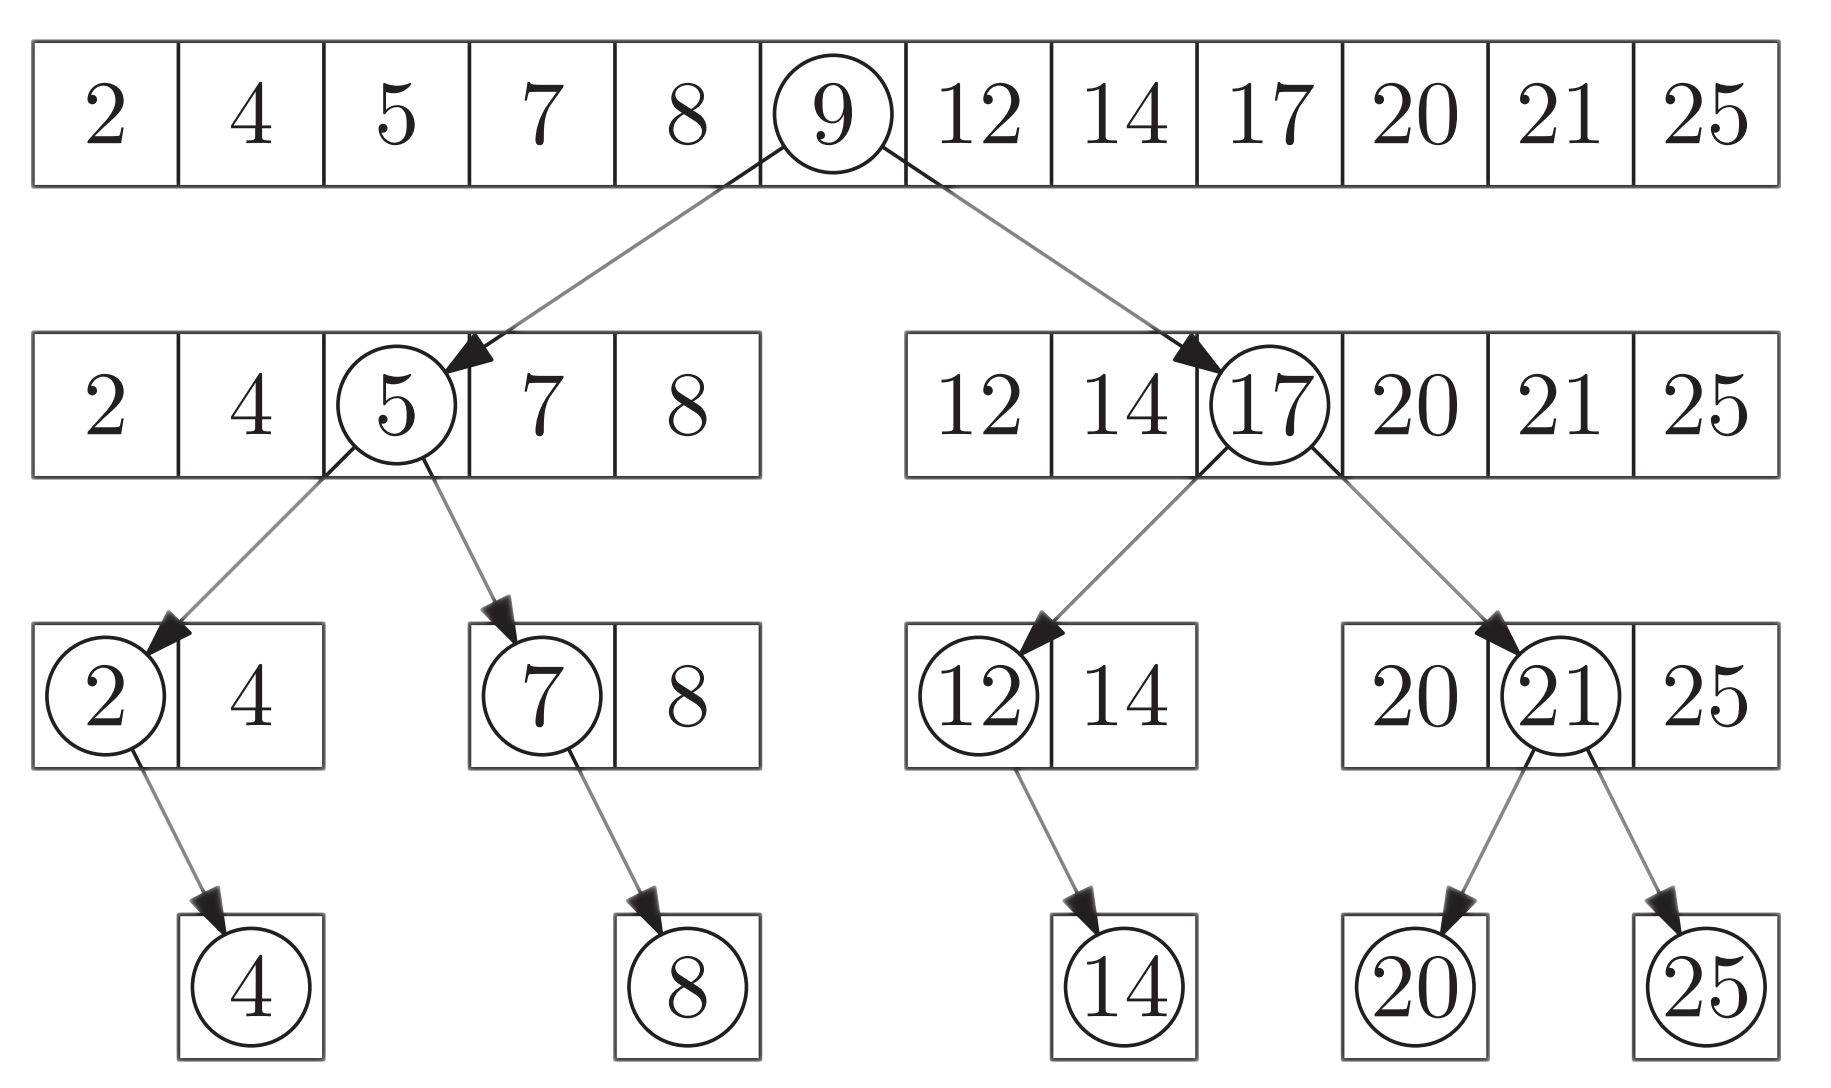
Consider the following ordered sequence of numbers:
$$ 2, 4, 5, 7, 8, 9, 12, 14, 17, 20, 21, 25 $$
Imagine we are searching for the value $x$, and we perform a binary search. The following illustration shows the decision tree (or comparison tree or search tree) corresponding to the binary search process.
A decision tree is a flowchart-like structure that models the decisions (conditional statements in an algorithm) and their possible outcomes (consequences).
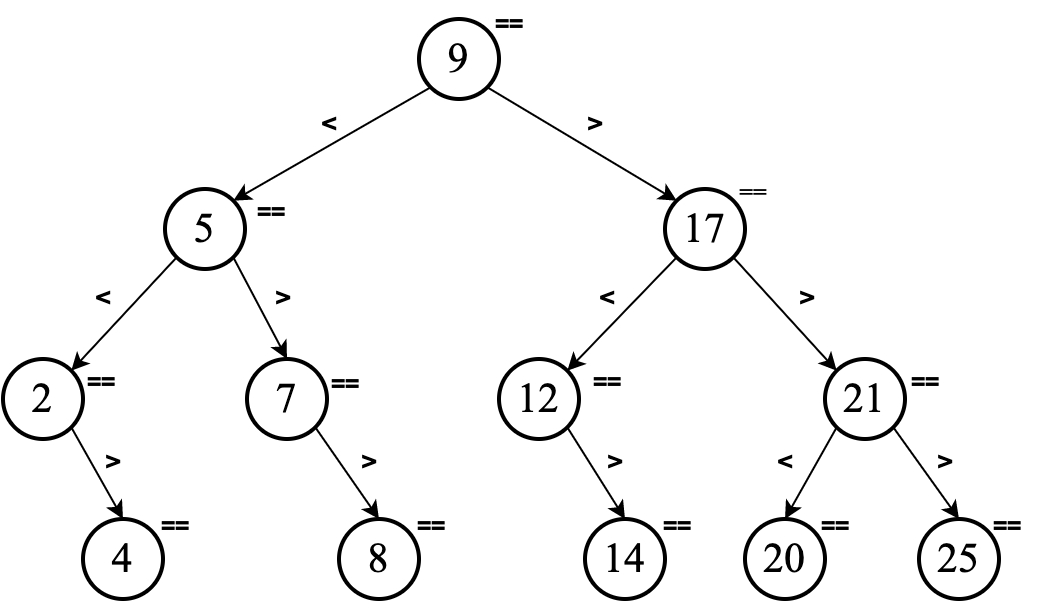
Irrespective of the value of $x$, we start the search by comparing it to the value of the element in the middle of the sequence, $9$. If $x = 9$ then the search ends. Otherwise, there are two possible outcomes:
- $x>9$, in which case we will explore the right half of the sequence (the next comparison will be against $17$).
- $x<9$, in which case we will explore the left half of the sequence (the next comparison will be against $5$).
This process is repeated until the search succeeds or fails (no more values are left to compare).